 This is a guest blog by Auke Hoekstra, senior adviser electric mobility at the Eindhoven University of Technology and developer of agent-based models for electric vehicles and renewable energy adoption. You can contact him at a.e.hoekstra@tue.nl or @aukehoekstra.
Update for 2018: the IEA once again predicts that global solar production capacity will decrease.
Why am I not surprised anymore?
Estimate 2018: BloombergNEF as of November. Thanks Jenny!
Update for 2017: the IEA is once again predicting the solar industry will stop growing. As you can see in the updated graph, yearly additions are still increasing rapidly but again the prediction of the IEA is flat. Fortunately many sources are noticing this or using “my” method for showing how far the IEA is off the mark. Examples here, here, here, here, here, here, here, here, here, here and here. I hope the criticism will grow exponentially until the IEA learns.

I posted a graph on Twitter illustrating the disconnect between historic projections regarding solar panels and actual developments. It was widely retweeted but people wanted to know how it was constructed. In this blog I explain step by step how I did it and I add some observations along the way.
I used thirteen World Energy Outlook (WEO) reports of the International Energy Agency (IEA). All data used in the production of the graph was taken from these tomes. I chose this publication because it is the most influential projection used by policy makers in the energy domain, but we could have taken other organizations (e.g. the EIA) where the disconnect is similar.
Introduction
Eleven years ago I was taking a sabbatical and contemplating a career change. I had been telling people for about twenty five years that Internet was going to be “huuuge”. When I started out that was fun because I saw something that few other people saw. But after twenty five years nobody needed convincing anymore. I was looking for a new frontier.
I started reading up on renewable energy and it struck me that the dominant source of information (the World Energy Outlook) seemed out of whack with what I read elsewhere. So I ended up playing with numbers in Excel. What I found was a disconnect to reality so profound that I decided I had found my new frontier. I wrote an article in the Dutch Financial Times (Het Financieele Dagblad, 17-7-2007, page 5) bitching about how Shell and IEA missed the exponential behind solar but let it go after I decided that writing some (Dutch) books on electric vehicles was a better ticket into this brave new world of renewable energy.
Recently I updated my excel (as part of a publication currently under peer review) and things hadn’t changed a bit. However, some people had written about it. I’ve included a list of links at the end of this post. So I don’t claim this is an insight nobody else had. I’ve just been pretty thorough and made a first derivative that is suitable for making a pretty picture.
A word of warning: not all renewables develop this fast
I have made a similar graph for wind and I think a similar development is going on regarding battery storage, electric vehicles and smart grids. But these are outliers. Looking at historic data I think you can state that: geothermal, tidal and concentrated solar power are getting cheaper more slowly; second gen biomass and biofuel (using scarce fertile soil and water) are only very slowly dropping in price and a bad idea; hydro is limited and hardly getting cheaper; nuclear has a devout following but it’s not clear that it’s getting cheaper; and CCS is not really happening. Dark horses that are currently in the R&D stage but that I think are ready to come bursting onto the scene are airborne wind energy, OTEC and solar fuels (=synthetic photosynthesis and algae).
Reviewing the Source Material
The first step in this analysis was of course to download all the IEA WEO documents from the iea.org website. The latest versions must be bought ($120,-) but the other ones can be downloaded for free after a bit of searching around on the site. These documents will not tell you exactly how the predictions were made but they do give you the predictions themselves and some remarks that give you a feel for what the IEA was thinking when they made the prediction. I’ll go through the reports one by one. You can skip to the next chapter if that doesn’t interest you.
The IEA has published more than 20 WEOs. They started in 1994. The first six WEOs (until 2000) only mention solar as something relevant for rural off-grid applications for remote areas. They do not make quantified predictions. (The WEO is the flagship publication of the IEA and uses the World Economic Model (WEM). The IEA also uses other models (e.g. TIMES) and publishes other publications.)
In WEO2001 three paragraphs are dedicated to photovoltaics stating it will continue to be used in rural electrification projects and that utility scale solar is unlikely to take place in the coming 20 years. (We now know that large scale solar is already a fast growing market segment.)
WEO2002 provides a reference scenario for solar (including all forms of solar, not just photovoltaics). Other scenarios are not quantified so we use the reference scenario (link). Interestingly this WEO also provides the estimate that the price reduction of solar would be 50-65% over the 2000-2030 time frame. (We now know that there has been a 95% price reduction of solar panels over the 2000-2015 time frame alone.)
WEO2003 does not provide a scenario for the growth of solar. It does predict a 63% decrease in the 2003-2030 time frame if the incentives foreseen in the alternative policy scenario are brought to bear. (Again instead of the 95% in reality.) What’s also interesting is that the WEO 2003 assumes a PV learning rate of 15% over the 2001-2010 time frame and a lower 10% rate between 2011-2030. This is remarkable because the PV learning rate has been a relatively constant 20-22% between 1975 and today and it’s not clear why the WEO deemed a slowdown plausible.
WEO2004 foresees solar (including photovoltaics) to rise to 2% of renewables in 2030 with renewables being a tiny sliver of all energy. The IEA analysis indicates that solar could be 4000 TWh in 2030 in the best possible scenario which would account for less than 0.5% of the total. The 2004 WEO predicts large scale PV will cost $3000/kW in 2030. (In reality it is already five to ten times cheaper.) Cost per kWh in 2030 is given a range of 13 to 33 cents. (In reality there are already contracts of 3 cents per kWh without and 4.5 cents with storage.) There is no quantitative alternative policy scenario so we use the reference scenario (link).
WEO2005 seems to be absent.
WEO2006 hints at an ambitious “alternative policy” scenario that could lead to 50 gigawatt of extra photovoltaic capacity in 2030. That’s an increase of around 35% over the 142 GW of the reference case. However, today we are already at 300 GW and the latest IEA scenarios predict 949 GW in 2030 so we feel comfortable sticking to the fully formed reference scenario: you won’t be able to see the difference with the alternative policy scenario on the chart. IEA cost predictions for 2030 have come down slightly to $2500/kW (but still many times too high, even looking at today).
WEO2007 scenarios are not expressed in GW (only TWh) and we want to keep interpretation to the minimum so we skip to WEO2008.
WEO2008 contains an interesting phrase: “In the Reference Scenario, the investment cost of a PV system is projected to fall to $2 600 per kW by 2030. There is optimism in the photovoltaics industry that very large cost reductions are in prospect, well before 2030.” In essence the IEA is stating: “Yes we know the sector expects stronger price reductions, but we don’t buy it.” They are wrong again as detailed in the MIT study “The Future of Solar Energy”. The picture on page 127 of that study is illuminating for two reasons. Firstly because it illustrates that the is EIA is just as detached from reality as the IEA. Secondly because the $2600/kWh the IEA is predicting in 2030 (after 22 years) was achieved in 2012 (after 4 years). And that’s MIT in a detailed study, not just yours truly.

WEO2009 states: “Most PV systems are installed in buildings rather than in central-grid power plants and this is likely to remain the case in the future. Central-grid based generation from PV is expected to remain costly, despite falling costs.” Page 215 shows that even with extreme policies (the 450 ppm scenario) renewables remain limited. Coal, gas, nuclear and hydro do the heavy lifting with a modest role for biomass and onshore wind and a very small role for solar.
WEO2010 starts with the New Policy Scenarios in which support is extrapolated based on current ambitions. So the IEA now adopts this “ambitious” scenario as the de facto reference scenario. It states: “The strong growth recently in new technologies — particularly wind power and solar photovoltaics (PV) — has created expectations among policy makers and the industry alike that these technologies will make a major contribution to meeting growing electricity needs in the near future. While power from renewables has been growing over the past decade, in absolute terms this growth pales beside the scale of the increase in fossil-fuel based generation.” And about photovoltaics it states: “Electricity produced from solar photovoltaics increases very rapidly, though its share of global generation reaches only around 2% in 2035.” In other words: “Don’t get your hopes up: it’s never ever gonna be big.”
WEO2011 states that “India has the ambitious plan to add 20 GW of solar by 2022.” We now know that this goal will probably will be reached before 2018. What caught my eye is that photovoltaic installations have an assumed lifespan of 20 years while nuclear and coal are assumed to have a 50 year long return on investment.
WEO2012 shows (if you look closely on page 228) that PV costs in 2030 are now expected to be $1700/kW. That’s about what MIT observed in 2014. Two points that are highlighted: solar uses a small fraction of the water that fossil fuels and nuclear need; photovoltaics added more peak power than nuclear but that nuclear produced more energy because of its higher capacity factor. The capacity factor is indeed super important when comparing technologies. For this reason I always use energy output and LCOE (cost per kWh) when comparing sources of energy.
WEO2013 states that China is where the growth is. Cumulative capacity will be 160 GW in 2035. Fortunately that figure will be reached this year and not in 2035.
WEO2014 predicts 4% electricity from photovoltaics in 2040 (and wind 8%) so still pretty marginal. It’s still almost all fossil fuels in 2040 according to the IEA. Page 240 is funny: “Solar photovoltaic saw the largest capacity additions ever in a single year.” That is funny because that statement is true for every single year since 1975. It shows that the IEA still has problems coming to grips with exponential growth.
WEO2015 predicts a 30-50% price decrease in Solar PV in 2040. That would mean that the fairly constant learning curve is now abruptly cut off. Why this cut off would occur is not explained. However, it might partly explain why PV’s share in power generation is only 3% in 2040.
WEO2016 states “The last few years have seen some large falls in the cost of some types of renewables, notably solar photovoltaic (PV), which have brought them closer to being commercially viable and boosted their deployment where government incentives are in place.” This statement surprises me because the price reduction has been entirely predictable for at least the last 25 years. The WEO also states: “Solar energy (photovoltaics and concentrating solar power) provides 4% of the world’s electricity supply in 2040 in the New Policies Scenario, while wind power contributes 8%. Strong cost reductions are expected for offshore wind as well over the outlook period, but they still require subsidies in most regions in 2040.” Since offshore wind is currently auctioned off for about $0.06/kWh this means that price reductions in offshore wind must actually be negligible over the next 25 years, at least compared to the last 5-10 years. Again the reason for this changing trend is not explained. We just have to take the IEA’s word for it.
WEO2017 states: “The future is electrifying. Electricity is the rising force among worldwide end-uses of energy. … Renewables capture two-thirds of global investment in power plants as they become, for many countries, the least-cost source of new generation. Rapid deployment of solar photovoltaics (PV), led by China and India, helps solar become the largest source of low-carbon capacity by 2040.” If you just read the text you get warm and fuzzy feelings about solar. But it’s almost like the calculations are done by a completely different person. Look at this graph on page 246:
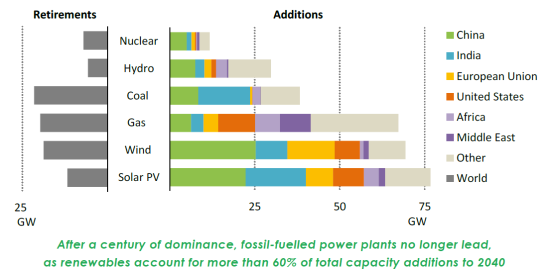
What is remarkable about this graph is that the yearly solar additions of 75 GW are the same as the yearly additions in 2016. What is also remarkable is that over 11 GW per year is retired, meaning solar cells would last for about 7 years. But what’s most remarkable is that in 2017 we already added about 100 GW. What gives?
The song that keeps playing in my mind is “You don’t believe”. Every year the IEA grudgingly accepts that solar sales have grown again but then stubbornly assumes that this year will finally mark the end of the solar growth nonsense. Let me show you.
Cumulative IEA projections versus reality
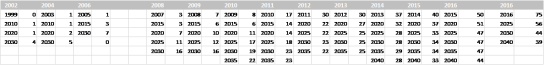
If we enter all aforementioned projections into an excel spreadsheet it looks like this:

If we make a graph based on this table it looks like this:
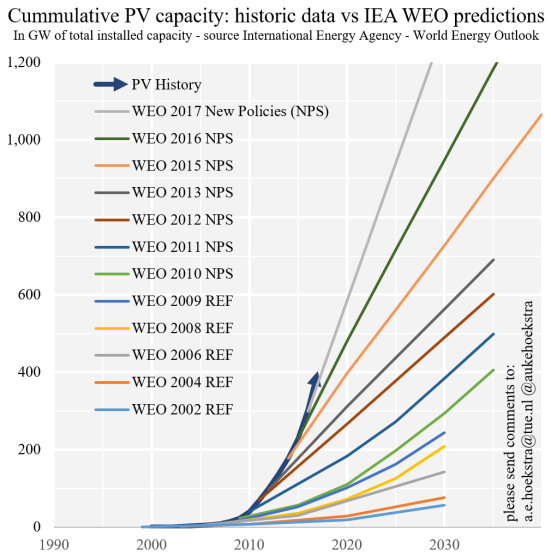
The problem with this table and graph is that it is hard to see what is happening exactly. We can see that the prediction gets steeper every year but the visual differences are small. More importantly this graph tells us very little about the developments in the photovoltaic sector. Will production capacity grow? Will factories producing solar panels open or close?
Comparing Yearly Growth with Reality
If we want to predict if factories open or close we should look at yearly additions. We can make a close approximation (a first order derivative in mathematical terms) by taking the difference between years in the previous table and by dividing that difference by the number of years.
E.g. the WEO2016 predicts that between 2020 and 2025 the installed capacity will grow from 481 to 715 gigawatt. That means that in those five years 715-481= 234 GW will be added. That is (on average) 234/5= 47 gigawatt per year. Applying this method we can see that the WEO predictions become very stable.
The following table shows what happens when we use this method:
If we make a graph based on the table it looks like the graph at the start of this post:

And if you are not scared of logarithmic chart the result becomes even clearer:
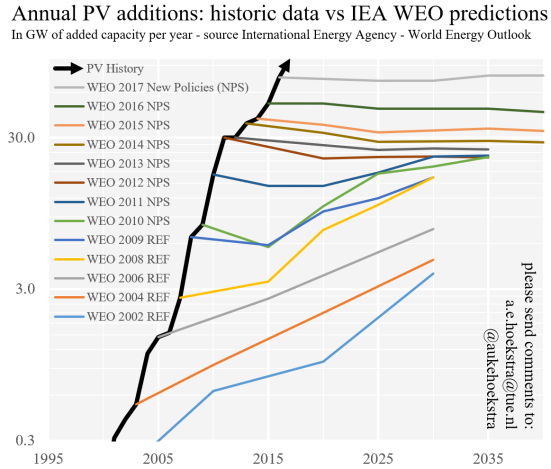
What this means in simple terms is that every single time since the future of photovoltaics was first predicted in the IEA WEO in 2002, the WEO has assumed the sector would hardly grow or even contract, even though this runs contrary to the observed reality.
To Forecast or Not to Forecast…
After I put this graph on Twitter, it provoked a multitude of reactions that the writer dutifully tried to answer. I have to emphasize that many tweeps gave examples of how the EIA and others produced comparably bad results and how even IRENA and Greenpeace have been too conservative in their predictions (although they where at least in the ballpark). So the IEA is just an example, not the only “culprit”.
The most interesting reactions came from the IEA itself,

and from its head of news.
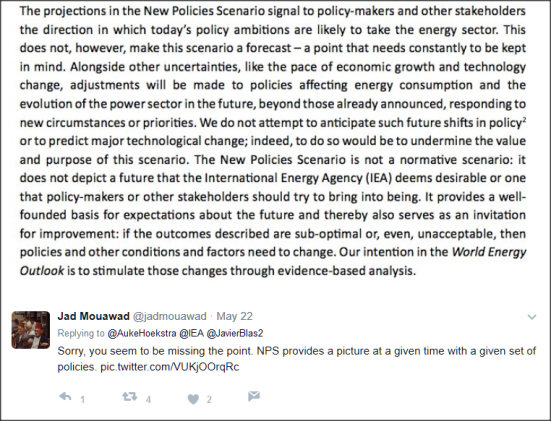
So the IEA claims the New Policies Scenario is not a “forecast” but a “projection” that only “signals to policy-makers and other stakeholders the direction in which today’s policy ambitions are likely to take the energy sector.” Nobody I’ve talked to has been able to explain to me how that is not a forecast and many experts in forecasting that I communicated with share my view that it is a forecast, plain and simple. But now you at least know the reaction of the IEA.
The New Policies Scenario assumes that ambitions stay constant and that this translates into new policies being enacted when old policies expire. So a country currently stimulating PV would keep doing that indefinitely in this scenario. The more conservative scenario is the current policies scenario where policies are not prolonged. The most aggressive scenario is the “450 ppm scenario” where the desire to stay below 450ppm leads the IEA to propose drastically more CCS and nuclear.
Every policy maker I have spoken to uses the New Policies Scenario as “this is what the IEA predicts will happen if we keep doing what we’re doing” and every forecasting expert I’ve spoken to concludes that they are perfectly right to do so.
So that leaves us with two possibilities. The first is that the policy ambitions for photovoltaics increased dramatically every time a new WEO was made. That seems highly implausible. The second possibility is that the IEA has a habit of dramatically underestimating photovoltaic growth.
The Emperor Wears No Clothes?
Maybe it is not a good career move to criticize an organization as influential as the International Energy Agency but the difference between predictions and reality is too staggering for my taste. So here we are.
I can think of multiple explanations:
- Incumbent industries almost never foresee radical innovations that develop along exponential trends. This was true for steam engines, planes, computers, Internet, mobile phones, digital cameras, et cetera. Now we might see the same thing happening in energy (including storage) and transportation (electric vehicles using batteries that are plummeting in price). So it could be a lack of imagination.
- Models that are honed using years and years of effort tend to become inflexible. That is especially true for relatively static equilibrium models that are often used in economics. They cannot deal with radical exponential change. I think this is one of the reasons why agent-based models are such a good idea, but I digress. So it could be inflexible models.
- The IEA could have been captured by the old fossil energy order in terms of thinking or interests. This could be conscious or unconscious. I would guess largely unconscious because I’m a firm believer in Hanlon’s razor.
- The IEA might assume costs that are much too high. This indeed seems to be the case. We saw that in WEO2004 the assumption for the capital costs in 2030 was around ten times higher than the actual capital cost in 2016. However this just reformulates the problem from “the WEO underestimates photovoltaic growth” to “the WEO underestimates photovoltaic price reductions”.
- The IEA might assume high storage costs because solar is an intermittent resource. Sources close to the modelers have told me that the use of solar “explodes” when storage is left out. So it could be an important variable. However, storage becomes more of an issue when the percentage of photovoltaics increases. Put simply: storage is no issue if less than 20% of electricity comes from photovoltaics (and after that smart grids, smart charging of electric vehicles and storage come into play) while the IEA model plateaus no matter how insignificant the adoption rate. So if storage is the cause, it is still modeled wrong.
Unfortunately this is all mere speculation because the underlying model (WEM) and its assumptions are not open for public scrutiny. The only thing we can say for sure that the IEA continuously predicts no growth in terms of solar factories being built and that has never been accurate.
Radical innovations surprise everyone, especially the experts of the old order. Maybe it would be beneficial if the IEA would make the model open source or at least share its basic assumptions so people outside the IEA inner circle can help to improve it.
Others Noticing the Same Disconnect
Just to show I’m not the only one doing the math on the disconnect between IEA photovoltaic projections and reality, here are some more sources:
Christian Breyer et al., “On the Role of Solar Photovoltaics in Global Energy Transition Scenarios,” ResearchGate, accessed June 12, 2017. It contains the phrase: “IEA scenarios have a more than 20-years track record of being fully incompatible with real world PV installations and it remains unclear why it is so complicated for the IEA to catch up with the level of insights of other institutions.”
Matthieu Metayer, Christian Breyer, and Hans-Josef Fell, “The Projections for the Future and Quality in the Past of the World Energy Outlook for Solar PV and Other Renewable Energy Technologies,” in 31st European Photovoltaic Solar Energy Conference and Exhibition, 2015. They show basically what I’ve shown but not the first derivative.
MIT, The Future of Solar Energy – An Interdisciplinary Study, May 2015, page 127. You already saw the graph under the WEO2008.
Rolf de Vos and David de Jager, “World Energy Outlook Hides the Real Potential of Renewables,” EnergyPost.eu, March 14, 2014. Both authors are respected energy consultants at Ecofys.
Terje Osmundsen, “How the IEA Exaggerates the Costs and Underestimates the Growth of Solar Power” EnergyPost.eu, March 4, 2014.
Terje Osmundsen, “IEA and Solar PV: Two World’s Apart” (Norwegian Climate Foundation Report, 2014).
Adam Whitmore, “Why Have the IEA’s Projections of Renewables Growth Been so Much Lower than the out-Turn?,” On Climate Change Policy, October 8, 2013.
Adam Whitmore, “The IEA’s Bridge Scenario to a Low Carbon World Again Underestimates the Role of Renewables,” On Climate Change Policy, June 27, 2015.
“How the IEA Exaggerates the Costs and Underestimates the Growth of Solar Power,” EnergyPost.eu, March 4, 2014.
David Roberts, “The International Energy Agency Consistently Underestimates Wind and Solar Power. Why?,” Vox, October 12, 2015.
“The International Energy Agency Undermines Global Climate Protection and Energy Security in Its Latest World Energy Outlook”, Energy Watch Group, November 30, 2016.
14-6-2017: Corrected some spelling errors (thanks Iris and @AustnNchols) and clarified definition of New Policies Scenario. 18-6-2017: Added link to 2007 article in Het Financieele Dagblad.
19-11-2018: Added the 2018 forecast based on the IEA WEO 2018 that appeared last week and used the end of 2018 forecast of BloombergNEF as of November 2018.

Great post Auke, compliments on your work! I’m curious: are the other energy scenarios (published by the oil giants, environmental groups, …) equally far off the truth when looking back?
My (not extensively researched) impression is that EIA, Shell, BP and Exxon are similar.
Renewable advocates are more optimistic and hence less wrong.
The only ones that seem on track to me are the outsiders that see solar, wind and batteries/EV as exponential developments. Think singularity university, Kurzweil, etc. I would include Ramez Naam and Tony Seba but they throw any caution to the wind.
Really nice read. Although I still assume IEA is independent of fossil industry, or at least have more stakeholders in their panels than solely fossils, you might argue they are not independent. Anyway, they owe a better explanation to you and society.
Coming from you that compliment is really nice to hear. And I agree that it is probably not nefarious intent at all. My hope is that my research is used to give IEA and others a wake up call and to make the predictions better validated and more evidence based.
Pingback: The Joy of Links | The Rationalist Conspiracy
Pingback: U.S. Solar Power Growth Blows Away Historical Expectations
Pingback: Better Predictions in Renewable Energy | Steinbuch
Hello Auke – I today found your article – what a great peace of research – indeed !
I wrote a very similar study for the Energy Watch Group (EWG) in 2009 [Rechsteiner, R. (2009) Wind Power in Context – A Clean Revolution in the Energy Sector, full study here]. I analysed IEA wind power forecasts and the results were the same as what you found out in 2017 for solar.
Click to access 01b_Wind_Power_in_Context_exec_summary_2008-12-18.pdf
http://energywatchgroup.org/wind-power-report-2009
Well, the renewables market was much smaller at that time (2009) compared with today, that’s why the renewable energy expansion today really hurts – and it puts enormous pressure on fossil fuel oriented companies such as General Electric within a few years and forces them to change. (https://www.ft.com/content/fc1467b8-c601-11e7-b2bb-322b2cb39656)
We in 2009 made a press conference in London and the Guardian published an article «International Energy Agency ‘blocking global switch to renewables’ on the questionable forecast methods of the IEA.
https://www.theguardian.com/environment/2009/jan/08/windpower-energy
My forecast in the study «wind power in context» was that starting around 2019 no more fossil fueled power stations will be sold.
The crucial question around the IEA misguidance is: why should anybody buy new coal and gas power stations if there is a cheaper source available ? and what about old coal and gas stations when rene-wables start to be cheaper than fossil fuel costs?
Of course all big companies with nukes or fossil fuels such as EDF and Shell are pointing to the ne-cessity of storage for fluctuating wind and solar – a necessity which they pretend could not be resolved soon.
However significant storage facilities are available today (such as hydro and biomass) and often seem to be neglected. The introduction of electric vehicles will deliver a huge demand for new batteries and will speed up the walk down the learning curve for lower battery prices – a significant positive loop for the renewable’s power sector, too.
The main mistake we as politicians made (I was an MP in Switzerland 1995-2010 and intrioduced feed-in-tariffs) was: we were too cautious and too soft spoken at the time (2008/2009). We should have pre-dicted the shake out of nuclear and coal and maybe some oft he misinvestments of the big companies could have been prevented.
In fact the significant output of solar and wind started to undermine electricity spot market prices start-ing in 2010, and from there power prices took their deep plunge downway. The rise of solar power re-duced the profitable annual time span for conventional power stations and reduced margins for incum-bent power producers, so had to close down assets, fell in debt and needed to restructure. Now they look for subsidies of all kind – and they seem to get it in Trump’s world. But this is just reargard action.
Great piece of research from you too. I hope a lot of people read it! I’ll add it to my blogpost and twitter about it.
Pingback: Briefly | Stats Chat
Pingback: Interesting Links for 27-11-2017 | Made from Truth and Lies
Pingback: Four short links: 27 November 2017 | | Crypto War - Bitcoin Guide
Pingback: Wird das Potenzial von Photovoltaik absichtlich kleinprognostiziert? - ÖkoEnergieBlog
Pingback: Photovoltaic growth: reality versus projections of the International Energy Agency – the 2017 update – ArticleZip.com
Pingback: Solceller: Virkeligheden overgår alle IEA´s forudsigelser - RÅSTOF
Pingback: A singularidade solar – Controvérsia
The IEA was chartered to protect oil and gas reserves.
And that’s what their projections do.
Pingback: The Solar Singularity: 2019 Update (Part 3) | Industry news
Pingback: What the Energy Transition Means for Investors – FFI
Pingback: CAGR как проклятие специалистов, или ошибки прогнозирования экспоненциальных процессов – CHEPA website
Pingback: Building the bridge to an all-renewable future - Fast Company - Investing in Green Energy
Pingback: Electric trucks: economically and environmentally desirable but misunderstood – Used Cars for Sale
Pingback: When it comes to renewable energy forecasting, Japan’s forecasting follows world lead
Pingback: Why President Trump Is Wrong About Solar Power - Natural Power Save
Pingback: Project Syndicate: Climate change has finally reached a tipping point that’s good – Profit Point Studio